问题出现
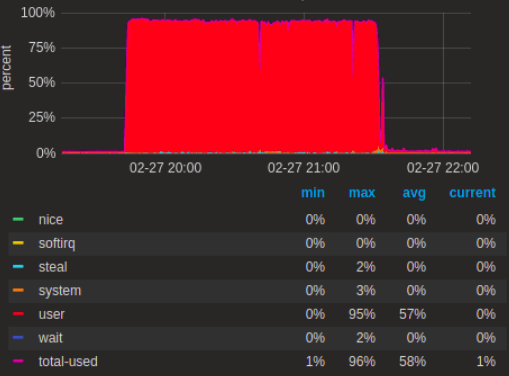
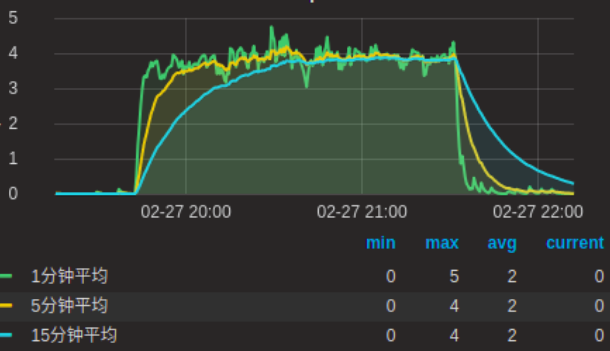
线上报警,看监控图,第一个是cpu使用率,第二个是load
排查步骤
- 查看cpu使用率高的几个线程
- 查看gc情况
- dump内存分析
- 根据dump分析结果排查具体原因
排查过程
查看cpu使用率高的几个线程
查看方法:linux性能瓶颈分析
结果如下:1
2
3
4
5
6
7
8
9
10
11
12
13
14
15
16
17
18
19
20
21
22
23
24
25
26
27
28
29
30
31
32
33
34
35
36
37
38
39
40
41The stack of busy(83.4%) thread(1549/0x60d) of java pid(1546) all times():
"GC task thread#0 (ParallelGC)" os_prio=0 tid=0x00007f98a801e800 nid=0x60d runnable
The stack of busy(81.4%) thread(1550/0x60e) of java pid(1546) all times():
"GC task thread#1 (ParallelGC)" os_prio=0 tid=0x00007f98a8020000 nid=0x60e runnable
The stack of busy(81.4%) thread(1551/0x60f) of java pid(1546) all times():
"GC task thread#2 (ParallelGC)" os_prio=0 tid=0x00007f98a8022000 nid=0x60f runnable
The stack of busy(77.4%) thread(1552/0x610) of java pid(1546) all times():
"GC task thread#3 (ParallelGC)" os_prio=0 tid=0x00007f98a8023800 nid=0x610 runnable
The stack of busy(17.9%) thread(1553/0x611) of java pid(1546) all times():
"VM Thread" os_prio=0 tid=0x00007f98a8077000 nid=0x611 runnable
The stack of busy(0.0%) thread(1546/0x60a) of java pid(1546) all times():
The stack of busy(0.0%) thread(1548/0x60c) of java pid(1546) all times():
"main" #1 prio=5 os_prio=0 tid=0x00007f98a8009800 nid=0x60c runnable [0x00007f98af608000]
java.lang.Thread.State: RUNNABLE
at java.net.PlainSocketImpl.socketAccept(Native Method)
at java.net.AbstractPlainSocketImpl.accept(AbstractPlainSocketImpl.java:409)
at java.net.ServerSocket.implAccept(ServerSocket.java:545)
at java.net.ServerSocket.accept(ServerSocket.java:513)
at org.apache.catalina.core.StandardServer.await(StandardServer.java:452)
at org.apache.catalina.startup.Catalina.await(Catalina.java:779)
at org.apache.catalina.startup.Catalina.start(Catalina.java:725)
at sun.reflect.NativeMethodAccessorImpl.invoke0(Native Method)
at sun.reflect.NativeMethodAccessorImpl.invoke(NativeMethodAccessorImpl.java:62)
at sun.reflect.DelegatingMethodAccessorImpl.invoke(DelegatingMethodAccessorImpl.java:43)
at java.lang.reflect.Method.invoke(Method.java:498)
at org.apache.catalina.startup.Bootstrap.start(Bootstrap.java:322)
at org.apache.catalina.startup.Bootstrap.main(Bootstrap.java:456)
The stack of busy(0.0%) thread(1554/0x612) of java pid(1546) all times():
"Reference Handler" #2 daemon prio=10 os_prio=0 tid=0x00007f98a807e800 nid=0x612 in Object.wait() [0x00007f9898dfc000]
java.lang.Thread.State: BLOCKED (on object monitor)
at java.lang.Object.wait(Native Method)
at java.lang.Object.wait(Object.java:502)
at java.lang.ref.Reference.tryHandlePending(Reference.java:191)
- locked <0x0000000080782fb0> (a java.lang.ref.Reference$Lock)
at java.lang.ref.Reference$ReferenceHandler.run(Reference.java:153)
很明显,cpu使用率较高的几个线程都是gc线程,ParallelGC并行回收四个gc线程,有三个在80%以上,一个77.4%
结论:内存有问题
查看gc和内存情况
1 | 2019-02-27T20:53:35.407+0800: 183330.132: [Full GC (Ergonomics) [PSYoungGen: 276991K->276991K(475136K)] [ParOldGen: 1398225K->1398224K(1398272K)] 1675217K->1675215K(1873408K), [Metaspace: 91794K->91794K(1134592K)], 1.4637406 secs] [Times: user=5.55 sys=0.00, real=1.46 secs] |
一直在full gc,YoungGen 和 OldGen 都gc不掉,每次stw 1.5s左右,不停的在stw,系统无法提供服务
看一下堆内存的使用情况:1
2
3
4
5
6
7
8
9
10
11
12
13
14
15
16
17
18
19
20
21
22
23
24
25
26
27
28
29
30
31
32
33
34
35
36
37
38
39
40
41
42
43
44
45
46Attaching to process ID 1546, please wait...
Debugger attached successfully.
Server compiler detected.
JVM version is 25.91-b14
using thread-local object allocation.
Parallel GC with 4 thread(s)
Heap Configuration:
MinHeapFreeRatio = 0
MaxHeapFreeRatio = 100
MaxHeapSize = 2147483648 (2048.0MB)
NewSize = 715653120 (682.5MB)
MaxNewSize = 715653120 (682.5MB)
OldSize = 1431830528 (1365.5MB)
NewRatio = 2
SurvivorRatio = 8
MetaspaceSize = 21807104 (20.796875MB)
CompressedClassSpaceSize = 1073741824 (1024.0MB)
MaxMetaspaceSize = 17592186044415 MB
G1HeapRegionSize = 0 (0.0MB)
Heap Usage:
PS Young Generation
Eden Space:
capacity = 283639808 (270.5MB)
used = 283639808 (270.5MB)
free = 0 (0.0MB)
100.0% used
From Space:
capacity = 202899456 (193.5MB)
used = 0 (0.0MB)
free = 202899456 (193.5MB)
0.0% used
To Space:
capacity = 218103808 (208.0MB)
used = 0 (0.0MB)
free = 218103808 (208.0MB)
0.0% used
PS Old Generation
capacity = 1431830528 (1365.5MB)
used = 1431780696 (1365.4524765014648MB)
free = 49832 (0.04752349853515625MB)
99.99651969985096% used
43030 interned Strings occupying 4910192 bytes.
eden使用了100.0% ,old使用了99.99651969985096%,已经基本用完了
所以现在应该看一下内存使用情况,分析一下内存使用哪里出问题了
dump内存分析
dump之后用mat分析的结果: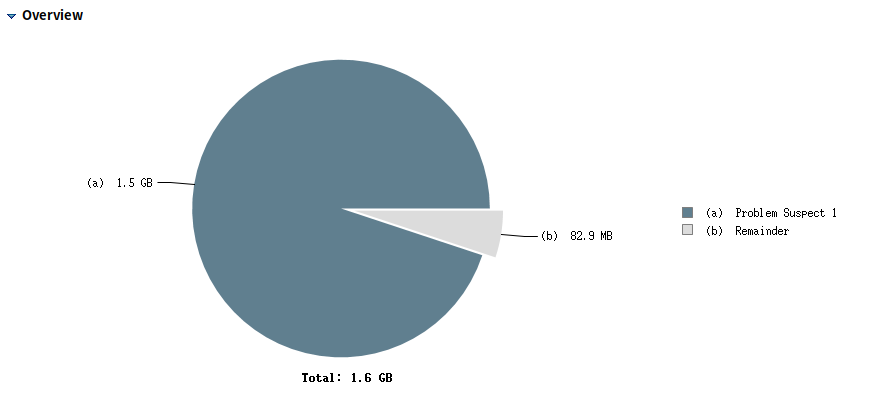
1 | http-bio-8080-exec-58 |
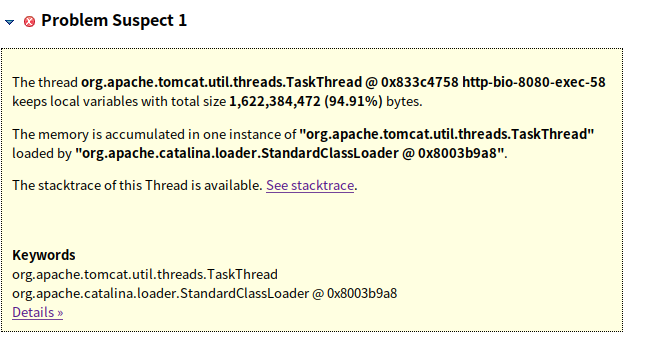
分析结果表示,有一个线程里的本地变量占了总内存的94.91%,将近1.5g大小
根据线程栈看出来,是ArrayList扩容的时候占的内存相当多,这个ArrayList的数据占了1.5个G,调用位置在ExportUtil.java:53,这是一个导出excel的工具类,在这里创建单元格,并设置值。
问题根源
问题根源在这里就查到了,同时根据access log能查出来,这是用户的一个导出数据操作,数据量上百万,于是就出问题了
问题根源有两点:
- 大量数据的情况下没有增加数量限制
- 堆内存设置的比较小,从配置信息可以看出来,heap只配了2g,但我们的机器内存有8G